6th Grade Data, Graphing and Statistics Math Games
What would you like to learn?
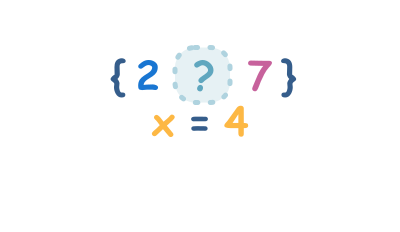
Calculate Mean missing data
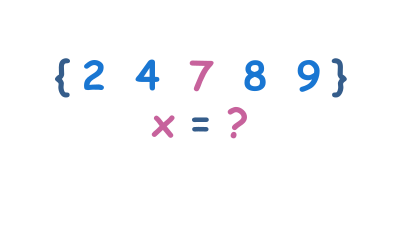
Calculate median (odd number of data points)
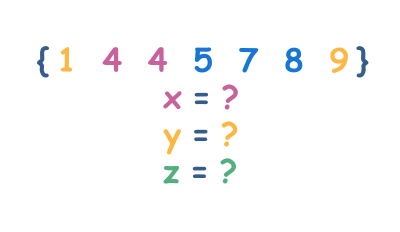
Calculate Mean , Median, Mode and Range
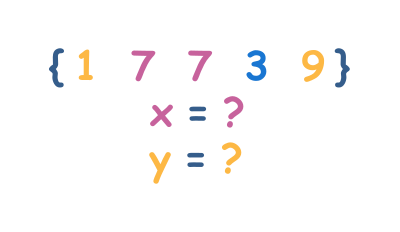
Calculate Mode and Range

Probability Problems

Logic and elimination problems - Level 2
Didn't find what you were looking for? Try checking all grade levels
6th Grade Data, Graphing, and Statistics Fun!
It’s time for the ultimate data adventure! In 6th grade, you’ll dive into histograms, box plots, and scatter plots, and explore probability and data distributions. Analyze real-world data, interpret graphs, and discover how statistics help us understand the world. Let’s go!
Need extra practice? Check out our 6th grade data, graphing and statistics printable worksheets and activities for more fun and learning!
